How to create a table in Google Sheets
Structure raw data with headers, types, filters and totals so sorting and formulas keep working as the sheet grows.
 Written by PhilisPublished July 24, 2026Last updated July 27, 20267 min
Put one field in each column, one record in each row and one header at the top. Select the range and choose Format → Convert to table when available, or add a filter, alternating colors and frozen headers for the classic table workflow.
A spreadsheet table is a promise: every row has the same meaning and every column contains one type of information. Once that promise is true, filters, formulas, summary tables and charts become much easier.
The visual styling matters less than the layout. Do not merge cells inside the data, do not leave decorative blank rows, and do not mix totals into the record area.
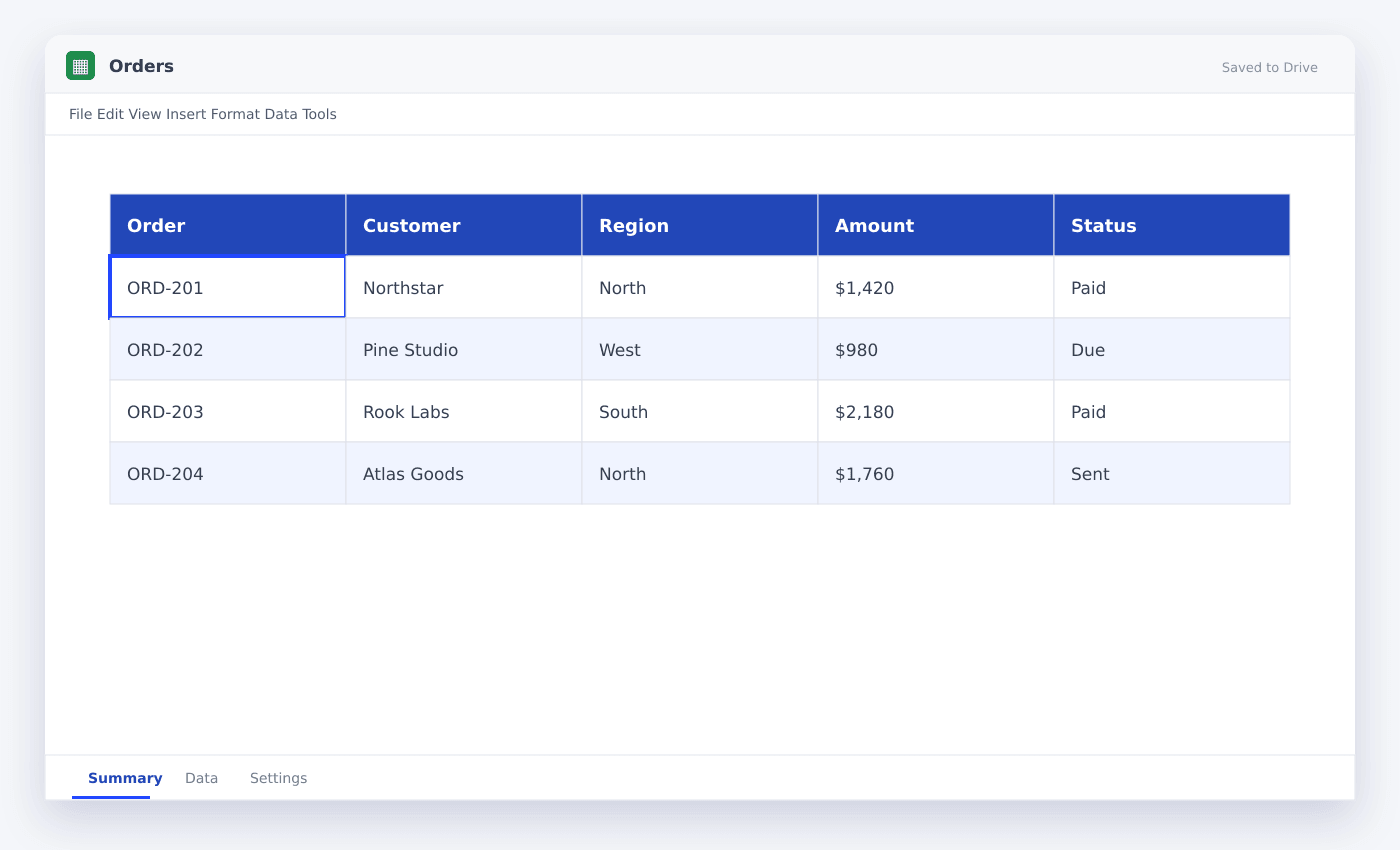
How to create a table in Google Sheets
- 01Write one header row
Use short unique labels for example Date, Customer, Region and Amount.
- 02Keep one record per row
Do not split a single order or person across several rows unless each row is a real line item.
- 03Use consistent data types
Keep dates as dates, amounts as numbers and identifiers as text.
- 04Add filters
Select the range and choose Data → Create a filter, or convert the range to a table.
- 05Freeze the header
Choose View → Freeze → 1 row so column meaning stays visible.
- 06Format intentionally
Use one header fill, subtle alternating rows and explicit date or currency formats.
Give every column one job
A useful table avoids combined fields. Store First name and Last name separately only if you need to sort or personalize by them. Store City and Country separately if you will group by geography.
Never type entries for example “$1,200 USD” into amount cells. Store 1200 as a number and use formatting to display the currency.
Add filters without losing rows
Filters apply to a rectangular range. Blank columns or blank header cells can cut that range unexpectedly. Select the complete table before enabling the filter.
Use filter views when several people share the sheet. A filter view lets each person inspect the same data without changing everyone else’s view.
Keep totals outside the data
A total row inside the source table can be included accidentally in a summary or chart. Put KPIs above the table or calculate totals on a separate summary tab.
If you need a total that reacts to filters, use SUBTOTAL instead of SUM.
=SUBTOTAL(9,D2:D500)Questions people ask
Does Google Sheets have Excel-style tables?+
Google Sheets now includes a table feature in many accounts, but classic ranges with filters remain common and compatible. Both require the same clean row-and-column layout.
Why does my filter miss some rows?+
A blank row, blank column or incomplete selected range usually stops the detected table. Remove separators and recreate the filter over the full range.
Should a table have merged cells?+
No. Merged cells inside data break sorting, filtering and many formulas. Reserve merges for titles outside the table.
More from SheetSteps

How to sort in Google Sheets without scrambling rows
6 min · Getting started

How to make a graph in Google Sheets
8 min · Data & charts

How to build a Google Sheets dashboard people can read
11 min · Data & charts